Hey!! Do you face issues of low power yield in your PV power project?
Possible causes of power losses might not be considered more meticulously at the project planning level those could adversely affect the performance output of PV power plants in longer run.
The pricing bids for gigawatt utility scale PV power projects across the globe have been touching new lows in the recent past. This paradigm shift has been pushing us to ensure more precise planning and forecasting of power/ yield output in such large scale power projects so that the economic life of the power project goes well beyond the committed period of 25 or 27 years. Many factors including the possible losses influence the life/economic viability of utility scale power projects. eSun has tried to consolidate the majority of causes which can result in yield/power losses in utility scale power projects. However, these factors do influence power yield for smaller ground mounted or large scale rooftop projects in the similar fashion as well. Hence, the project planning and of course the operation and maintenance (O&M) strategies must be accomplished taking into consideration these very many factors. Let’s go through these losses for better our understanding:-
- Module temperature : The power output of PV modules is measured under standard temperature conditions of 25˚C. As the temperature is up by a degree Celsius, the output of PV crystalline modules reduces by roughly 0.5%. The module temperatures go high significantly up to 60˚C under high ambient temperatures with strong irradiance though wind provides cooling effect. Hence, site weather conditions provide significant information for calculating the output of the PV power plant and output generation losses occurred due to high module temperature.
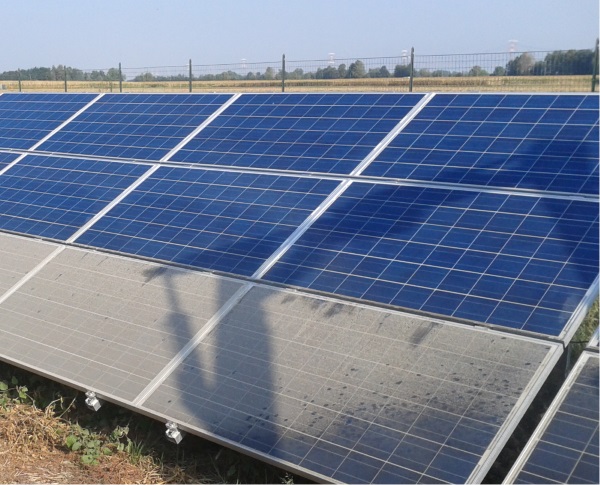
- Soiling: The energy losses caused due to soiling on PV modules like dust etc generally account for less than 4% but it can reach up to 15% annually in some cases especially in desert areas. However, the losses can be greatly impacted due to environment and rains and cleaning practices being adopted at the project under operations and maintenance contracts. The soiling losses are maximum contributors to the performance of the PV power plant, hence should be accommodated in calculating the IRR of the power plant and should be planned to be tackled accordingly. The robotic waterless cleaning has been greatly encouraged due to high consumption of water required for cleaning of soiling caused due to environmental dust. High tilt angle modules generally are better placed due to natural cleaning during rainy seasons. The soiling losses are generally found similar in fixed or tracking systems.
- Low irradiance: The light intensity impacts the conversion efficiency of PV modules. The losses caused due to low light intensities when compared with the Standard Test Conditions (STC) (1000W/m2) are covered under low irradiance. This type of loss is mainly dependent on the characteristics & technology of modules and the intensity of the incident radiation. The data about output loss due to low irradiance is provided by the module manufacturers but the information provided by independent testing labs/ institutes should be more reliable for calculating such losses in the project under design.
- Air pollution: Air pollution plays a major role in determining the performance of the PV Power Plant. Due to air pollution from emissions created by vehicles, industry, agriculture, construction activities and surroundings, generation capacity of a solar power plant can be significantly reduced in some places. The solar irradiance incidence on the module is greatly impacted and thereby reduces power generation. It is more important in urban and semi-urban locations, especially in densely industrialized countries.
- Grid availability and disruption: Grid availability losses or losses due to grid side disruptions are generally out of control of the power plants, however, these should be well accounted for during the calculation of IRR of the PV power plants. Unless confirmed data is available, this loss is generally taken on an assessment that the local distribution network will not be available for a given number of hours/days in a year.
- Inverter performance: Inverter performance losses occur during the conversion of current from DC to AC depending upon the inverter load. Inverter Manufacturers provide an inverter’s efficiency profile for low, medium and high voltages. This inverter profiling data can be given to the modeling software for providing more accurate inverter losses.
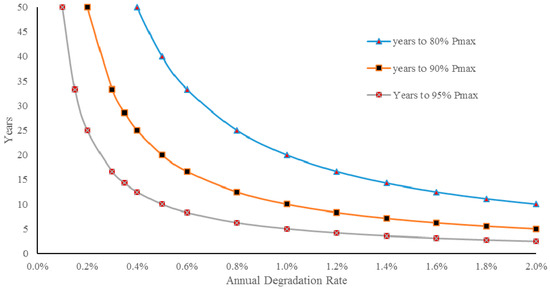
- Degradation: The power generation ability or performance of solar modules diminishes with the passage of time. The assumption about such losses should be done either based on independent lab test reports or generic industry standard rate based on module technology. More conservatively speaking, a maximum degradation rate which has been specified by the module manufacturer in its module performance warranty document can be a good benchmark for assessment.
- Module mismatch: Practically speaking, the PV modules rated at a particular power wattage (Current/voltage profiling) present in the string do not behave in the similar fashion due to statistical variation in their actual output. This mismatch has been resulting in power losses in the power plants. These losses are directly related to the modules’ power tolerance.
- Shading: The losses in power generation caused by shadowing of nearby buildings, trees, overhead cablings, mountains and mutual shading between rows of modules are covered under shading losses. Since these losses are quite significant, the projects must be tested at designing stages with 3D modeling software for accurate assessment of shading losses.
- Module quality: The PV module quality plays a significant role in project modeling. The losses occur due to power rating of PV modules that do not exactly match the manufacturer’s nominal specifications. These modules are offered based on their nominal peak power with a guarantee of actual power within a given tolerance range. Hence, these losses quantify the impact on the power generation due to difference in actual module characteristics from the typical specifications offered by the module manufacturers. The module output power at STC (Standard Test Conditions) is greater than the nominal power given in the module datasheets given by the manufacturers.
- Electrical shading: The losses occurred due to orientation towards the equator e.g. modules installed in landscape orientation towards the equator have less electrical shading losses in comparison to portrait installations due to the diode connections. These losses are typically seen in crystalline PV modules rather than in thin-film modules, hence factors like orientation, module technology and tracking/fixed system should be well accounted for in the modeling software. The effect of partial shadings on electrical production of the PV plant is non-linear and is modelled through partitioning of the strings of modules only.
- Incident angle: These losses are encountered due to radiation reflected from the front glass when the sun light striking is not perpendicular. These losses can be expected more in case of tilted PV modules rather than in dual axis tracking systems.
- MPP tracking: One of the key performance indicators of inverters is to find the maximum power point (MPP) of the module arrays by shifting the inverter voltage to the MPP voltage. However, different inverters do this with varying efficiency, hence this typical data provided by inverter datasheets are relevant in project modeling for calculating such losses.
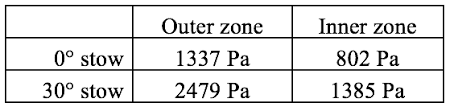
- Curtailment of tracking: Power output losses can occur due to high velocity of winds enforcing the ‘stow mode’ of tracking systems so that the solar modules are not optimally orientated.
- Transformer performance: The losses which occur due to the characteristics of the transformer like iron and resistive/inductive, can be assessed based on the transformer’s no-load and full-load losses.
- DC cable losses: The DC cable losses typically characterize due to the electrical resistance in the cable between the input terminals of the inverter and the modules that give rise to ohmic losses (I²R). Further, such losses increase with rise in temperature. But if the size of cable is correctly decided, such losses should be below 3% per annum.
- AC cable losses: Such losses are due to the ohmic losses in the AC cabling. AC cables are installed post inverter up to the metering point. AC cable losses are typically lesser than DC cable losses in a power plant and are typically smaller for plants that use central inverters.
- Auxiliary power: Auxiliary power losses include the use of power for electrical equipment within the plant itself. These usages generally include tracking motors, monitoring equipment, security systems and lighting in the plant. Plants with central inverter configurations will typically experience higher auxiliary losses than string inverter configurations. It is normally suggested to meter these auxiliary power requirements for better understanding of energy production. Typically the auxiliary losses differ during day time and nighttime.
- Downtime: Downtime losses are encountered when there is some failure in the plant. Such losses are due to quality issues in plant components, design, diagnostic response time, environmental conditions and repair response time.
- Grid compliance loss: Typically excessive loading of local distribution network equipment such as power transformers or overhead lines may lead to grid instability. The voltage and frequency of the grid may go beyond the operational limits of the PV power plant inverters and this might cause plant downtime. In regions with less developed networks, the risk of PV power plant downtime caused by grid instability issues can have serious repercussions for the project viability as well.